 NSW Geoscience Metadata
2025
Type of resources
Available actions
Topics
Keywords
Contact for the resource
Provided by
Years
Formats
Representation types
Update frequencies
status
Scale
-
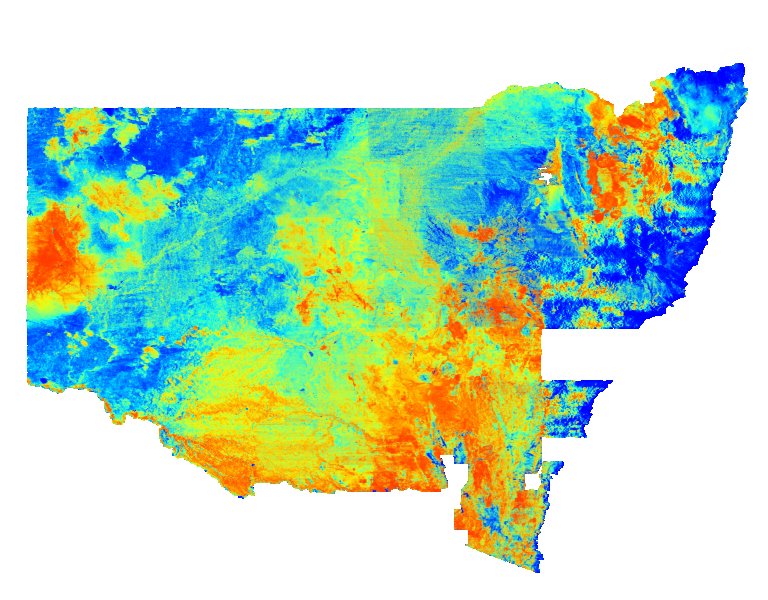
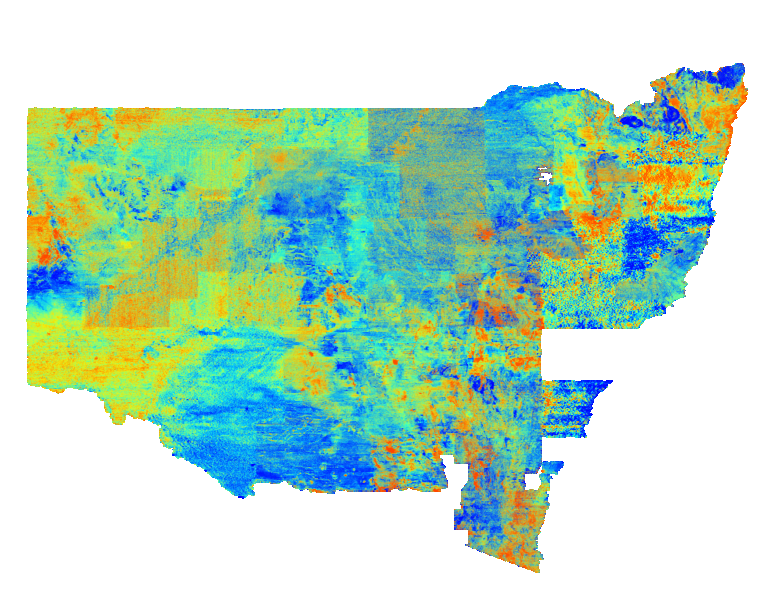
Pseudocolour image of the concentration of uranium in parts per million within in the upper 20 centimetres of the ground. Cooler colours indicate lower abundances of uranium and warmer colours represent higher abundances. Variations in uranium values are caused by varied mineral compositions in host rocks and soils. This statewide image was generated by merging many individual airborne radiometric surveys.
-
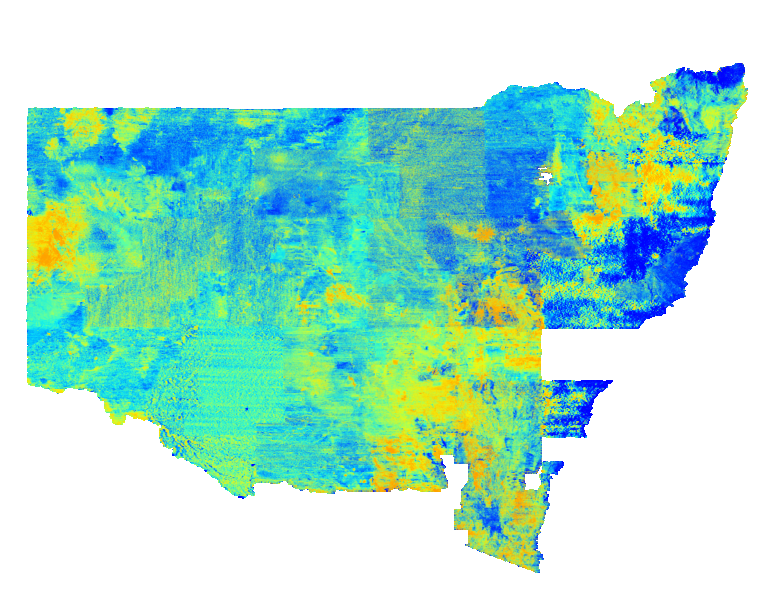
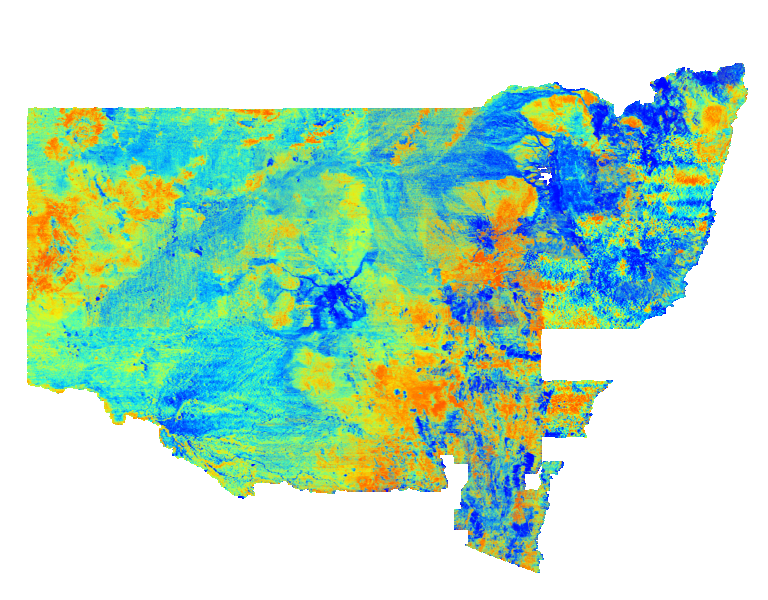
Pseudocolour image of the ratio between uranium and thorium within the upper 20 centimetres of the ground. Cooler colours indicate lower abundances of uranium relative to thorium and warmer colours represent the opposite. Variations in U2/Th ratio are caused varied mineral compositions in host rocks and soils. This statewide image was generated by merging many individual airborne radiometric surveys.
-

The Critical Mineral Analysis Project data set contains the analysis of a representative collection of the Geological Survey of New South Wales (GSNSW) existing rock and analytical powder collections to support the exploration for critical minerals. Existing pulps and powders from whole rock igneous rocks and mine dump samples were submitted for geochemical analysis to ensure the application of modern analytical techniques with significantly improved precision, detection limits for an extended range of trace elements, including the full complement of rare earth elements. Suites of mineral and rock samples from the Economic Rock and Mineral Collection were also selected for analysis from a variety of deposits, deposit types and regions across NSW. These comprise mineralised rocks and drillcore billets, and aggregates of ore minerals.
-

Greyscale image of first vertical derivative (1VD) of isostatic residual gravity (Iso-grav). The 1VD filter shows the rate of change in the isostatic gravity data. Darker tones indicate lower values and lighter tones represent higher values. Attention: Please ensure your version of the NSW gravity merges contains the date ‘2024-10-30’ in their filename. An update was made to remedy location errors in the initial release. Apologies for any inconvenience.
-
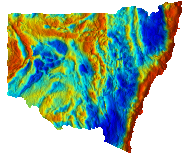
Pseudocolour image of Bouguer gravity with a histogram-equalised colour stretch. Cooler colours indicate lower Bouguer gravity values and warmer colours represent higher values. The intensity layer is the Bouguer gravity greyscale image enhanced by a 3x3 sun filter with the sun illumination set at 45 degrees elevation and 90 degrees azimuth. Bouguer gravity compensates for variations in latitude, 'free-air' elevation and Bouguer correction (assuming a crustal density of 2.67 T/m³). Attention: Please ensure your version of the NSW gravity merges contains the date ‘2024-10-30’ in their filename. An update was made to remedy location errors in the initial release. Apologies for any inconvenience.
-
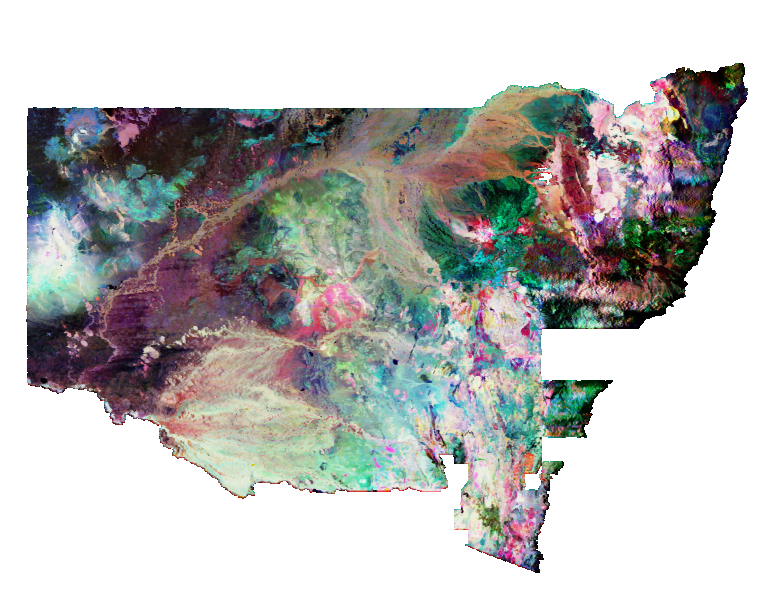
Ternary radioelement potassium(K)-thorium(Th)-uranium(U) channel data. The image was generated by merging many individual airborne surveys and is a red-green-blue (RGB) composite using a histogram-equalised colour-stretch for each of the three channels. The red, green and blue channels represent K, Th and U respectively. Mixed compositions are indicated by the proportional blend of the corresponding additive primary colours (e.g. yellow indicates the presence of both K and Th, magenta the presence of K and U while aqua indicates the presence of Th and U). Black indicates low concentrations and white represents high concentrations for all three radioelements. The distribution of radioelements reflects the geochemistry and mineralogy of the near-surface, which may constitute either bedrock or regolith materials. The NSW statewide grid DVD set includes K values in percent(%), Th values in parts per million (ppm) and U values in parts per million (ppm). This dataset is part of the Geological Survey NSW State Geophysics data set series.
-

Greyscale image of first vertical derivative (1VD) of Bouguer gravity. Darker tones indicate lower values and lighter tones represent higher values. Bouguer gravity compensates for variations in latitude, 'free-air' elevation and Bouguer correction (assuming a crustal density of 2.67 T/m³). Attention: Please ensure your version of the NSW gravity merges contains the date ‘2024-10-30’ in their filename. An update was made to remedy location errors in the initial release. Apologies for any inconvenience.
-

The semi-transparent isostatic residual gravity image is displayed using cooler colours (blue) to indicate lower gravity values and warmer colours (red) represent higher values. The underlying greyscale tilt-angle filtered total magnetic intensity image that has been reduced to the pole (Tilt TMI RTP). The tilt-angle filter of the total magnetic intensity produces a local positive maximum (white) over a magnetic source and is zero near the edge of the source (grey), and is useful for tracing geological structure below variable depths of cover. Both image layers were generated using a histogram-equalised colour-stretch. Attention: Please ensure your version of the NSW gravity merges contains the date ‘2024-10-30’ in their filename. An update was made to remedy location errors in the initial release. Apologies for any inconvenience.
-
Pseudocolour image of the ratio between uranium and thorium within the upper 20 centimetres of the ground. This image was generated using normalised input grids to avoid ‘divide by zero’ errors. Cooler colours indicate lower abundances of uranium relative to thorium and warmer colours represent the opposite. Variations in U/Th ratio are caused varied mineral compositions in host rocks and soils. This statewide image was generated by merging many individual airborne radiometric surveys.
-
Pseudocolour image of the ratio between uranium and potassium within the upper 20 centimetres of the ground. This image was generated using normalised input grids to avoid ‘divide by zero’ errors. Cooler colours indicate lower abundances of uranium relative to potassium and warmer colours represent the opposite. Variations in U/K ratio are caused varied mineral compositions in host rocks and soils. This statewide image was generated by merging many individual airborne radiometric surveys.