 NSW Geoscience Metadata
WCS
Type of resources
Available actions
Topics
Keywords
Contact for the resource
Provided by
Years
status
-
The Central NSW 10 metre grid package is a dataset containing best available open-file geophysical data spanning twelve 1:250,000 geological mapsheets, from Cobar in the northwest to Bathurst in the southeast. Available within the package are merged grids and high resolution imagery providing excellent geophysical coverage of the region. Gridded products include: • Digital Elevation Model (DEM) • Total Magnetic Intensity (TMI) • Total Magnetic Intensity Reduced to The Pole (TMI RTP) • Total Magnetic Intensity Reduced to The Pole First Vertical Derivative (TMI RTP 1VD) • Total Magnetic Intensity Reduced to The Pole Second Vertical Derivative (TMI RTP 2VD) • Total Magnetic Intensity Reduced to The Pole Tilt Angle Filter (TMI RTP Tilt) • Potassium Percentage (Kperc) • Thorium Parts Per Million (Thppm) • Uranium Parts Per Million (Uppm) • Radiometric K-Th-U Ternary (KThU) • Radiometric Dose Rate (Dose) • Thorium divided by Potassium (ThdivK) • Uranium divided by Potassium (UdivK) • Uranium divided by Thorium (UdivTh) • Uranium Squared divided by Thorium (U2divTh) • Isostatically Corrected Bouguer Gravity (Iso Grav) Images for each grid are also available, with the addition of: • DEM (Terrain) • TMI RTP overlaid on TMI RTP Tilt • Iso Grav overlaid on TMI RTP Tilt
-
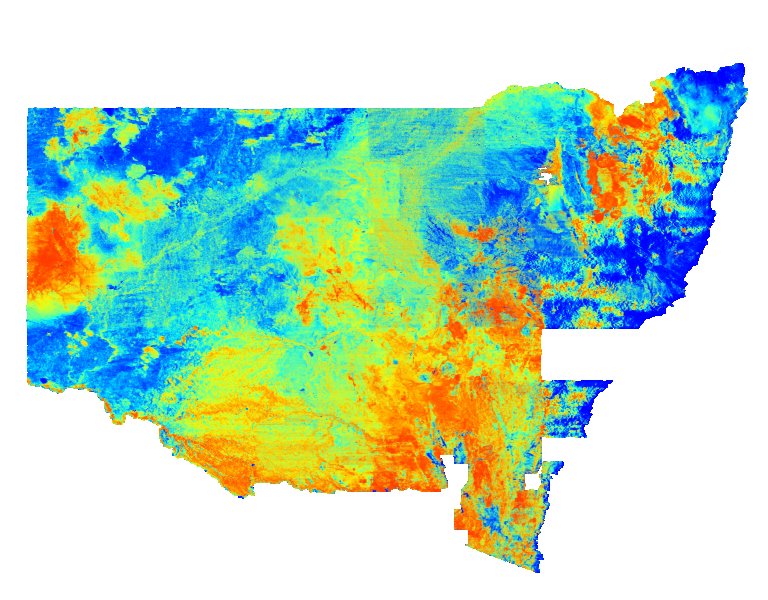
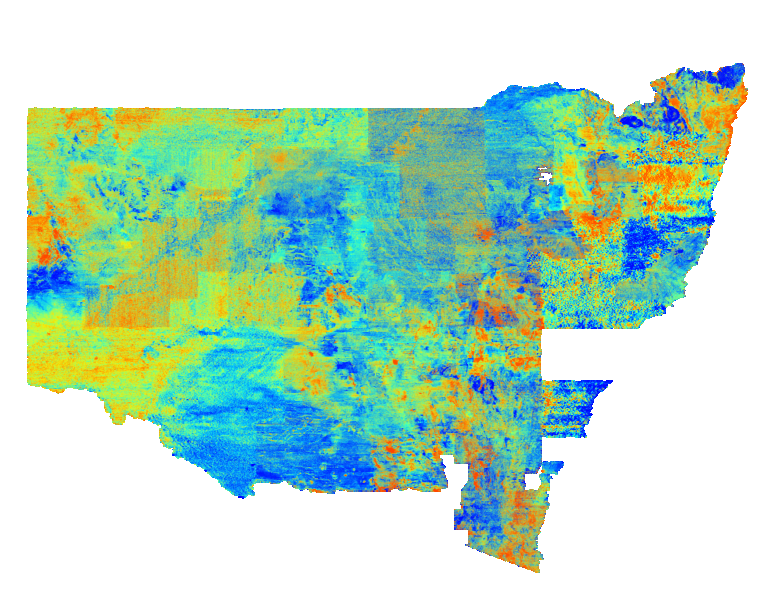
Pseudocolour image of the concentration of uranium in parts per million within in the upper 20 centimetres of the ground. Cooler colours indicate lower abundances of uranium and warmer colours represent higher abundances. Variations in uranium values are caused by varied mineral compositions in host rocks and soils. This statewide image was generated by merging many individual airborne radiometric surveys.
-
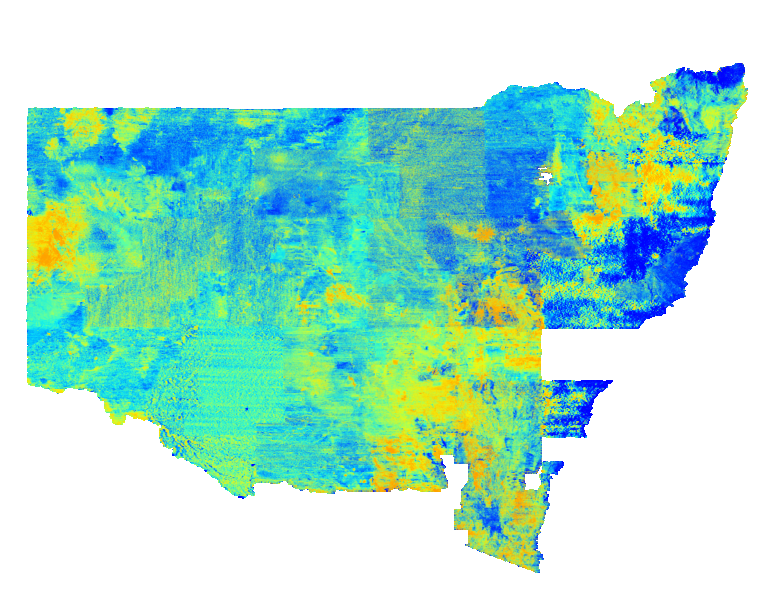
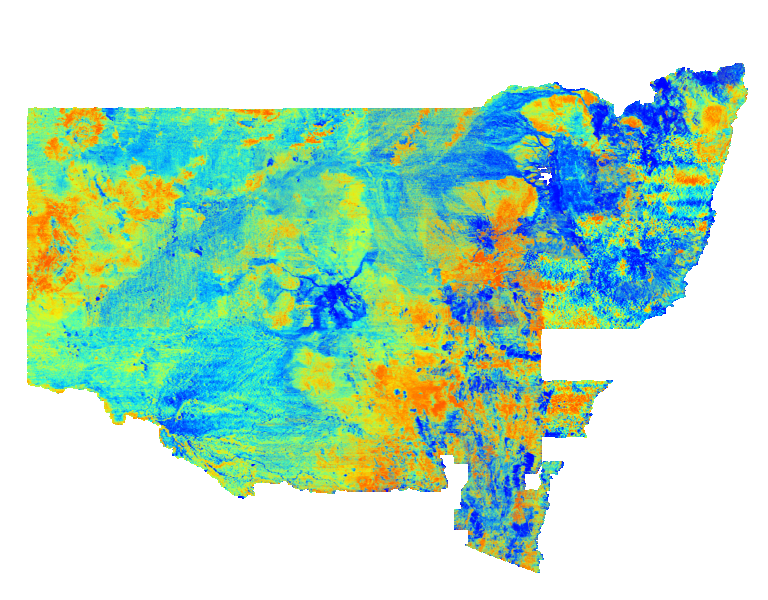
Pseudocolour image of the ratio between uranium and thorium within the upper 20 centimetres of the ground. Cooler colours indicate lower abundances of uranium relative to thorium and warmer colours represent the opposite. Variations in U2/Th ratio are caused varied mineral compositions in host rocks and soils. This statewide image was generated by merging many individual airborne radiometric surveys.
-
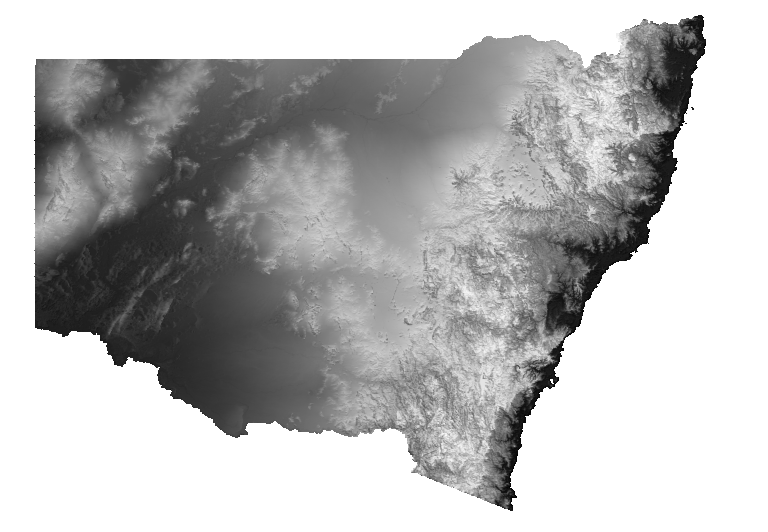
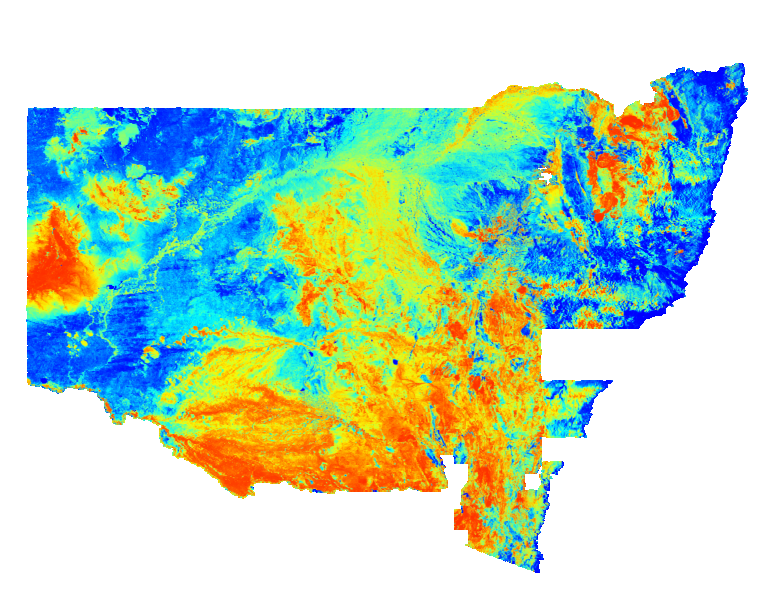
Elevation is a greyscale layer with a histogram-equalised colour stretch. Cooler colours indicate lower values and warmer colours represent increasingly higher elevation. Elevation is derived from 5 metre LiDAR coverage of NSW and has been resampled to a uniform 25 metre grid cell size.
-
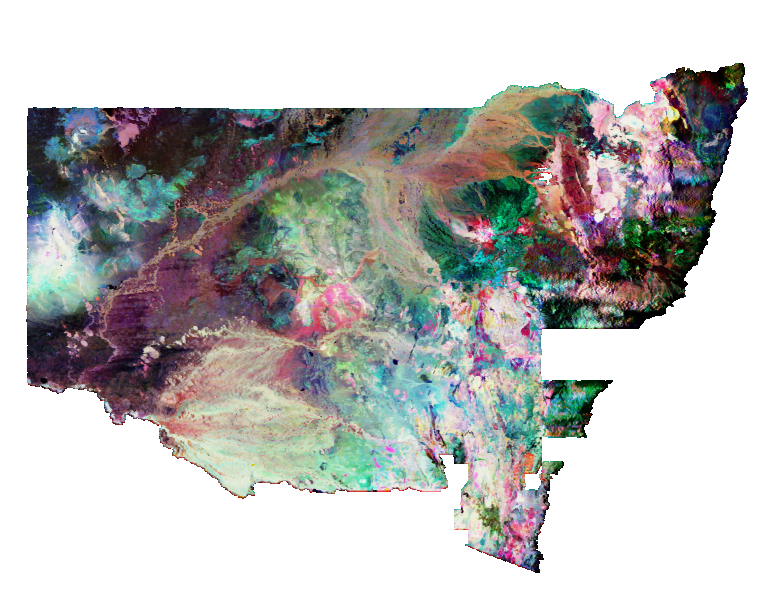
Ternary radioelement potassium(K)-thorium(Th)-uranium(U) channel data. The image was generated by merging many individual airborne surveys and is a red-green-blue (RGB) composite using a histogram-equalised colour-stretch for each of the three channels. The red, green and blue channels represent K, Th and U respectively. Mixed compositions are indicated by the proportional blend of the corresponding additive primary colours (e.g. yellow indicates the presence of both K and Th, magenta the presence of K and U while aqua indicates the presence of Th and U). Black indicates low concentrations and white represents high concentrations for all three radioelements. The distribution of radioelements reflects the geochemistry and mineralogy of the near-surface, which may constitute either bedrock or regolith materials. The NSW statewide grid DVD set includes K values in percent(%), Th values in parts per million (ppm) and U values in parts per million (ppm). This dataset is part of the Geological Survey NSW State Geophysics data set series.
-
Pseudocolour image of the ratio between uranium and thorium within the upper 20 centimetres of the ground. This image was generated using normalised input grids to avoid ‘divide by zero’ errors. Cooler colours indicate lower abundances of uranium relative to thorium and warmer colours represent the opposite. Variations in U/Th ratio are caused varied mineral compositions in host rocks and soils. This statewide image was generated by merging many individual airborne radiometric surveys.
-
Pseudocolour image of the ratio between uranium and potassium within the upper 20 centimetres of the ground. This image was generated using normalised input grids to avoid ‘divide by zero’ errors. Cooler colours indicate lower abundances of uranium relative to potassium and warmer colours represent the opposite. Variations in U/K ratio are caused varied mineral compositions in host rocks and soils. This statewide image was generated by merging many individual airborne radiometric surveys.
-

Elevation is a pseudocolour layer with a histogram-equalised colour stretch. Cooler colours indicate lower values and warmer colours represent increasingly higher elevation. Elevation is derived from 5 metre LiDAR coverage of NSW and has been resampled to a uniform 25 metre grid cell size.
-
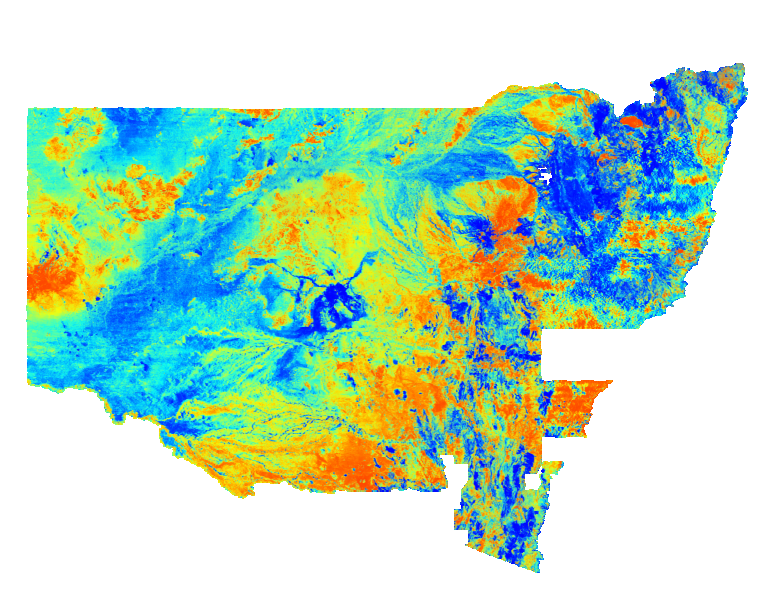
Pseudocolour image of the concentration of thorium in parts per million within in the upper 20 centimetres of the ground. Cooler colours indicate lower abundances of thorium and warmer colours represent higher abundances. Variations in thorium values are caused varied mineral compositions in host rocks and soils. This statewide image was generated by merging many individual airborne radiometric surveys.
-
Pseudocolour image of the ratio between thorium and potassium within the upper 20 centimetres of the ground. This image was generated using normalised input grids to avoid ‘divide by zero’ errors. Cooler colours indicate lower abundances of thorium relative to potassium and warmer colours represent the opposite. Variations in Th/K ratio are caused varied mineral compositions in host rocks and soils. This statewide image was generated by merging many individual airborne radiometric surveys.