 NSW Geoscience Metadata
Statewide
Type of resources
Topics
Keywords
Contact for the resource
Provided by
Years
Formats
status
-
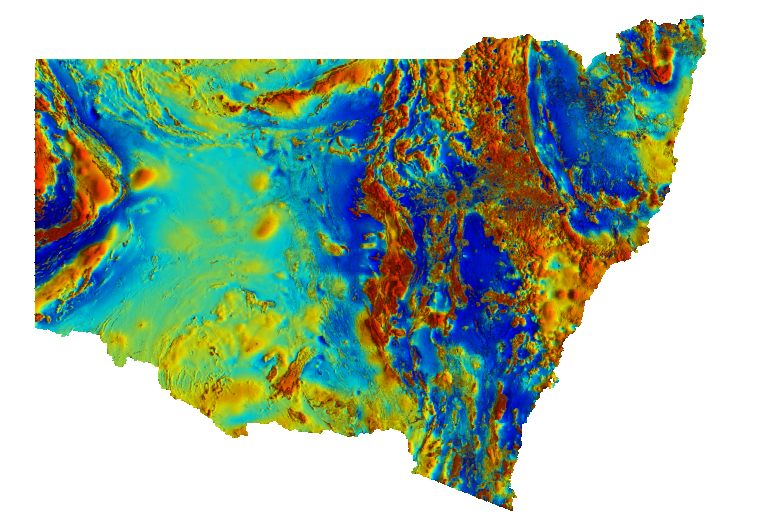
Pseudocolour image of total magnetic intensity reduced to the pole (TMI RTP) with a histogram-equalised colour-stretch. Cooler colours indicate lower magnetic intensity values and warmer colours represent higher values. The intensity layer is the TMI RTP greyscale image enhanced by a 3x3 sun filter with the sun illumination set at 45 degrees elevation and 90 degrees azimuth. Reduction to the pole filters magnetic anomalies to appear as if the Earth's magnetic field were locally vertical, as at the magnetic pole (assuming all magnetic sources are inductively magnetised). Variations in the magnetic field are caused by lithological factors, principally magnetite (and/or pyrrhotite) content. This Statewide image was generated by merging many individual airborne magnetic surveys.
-
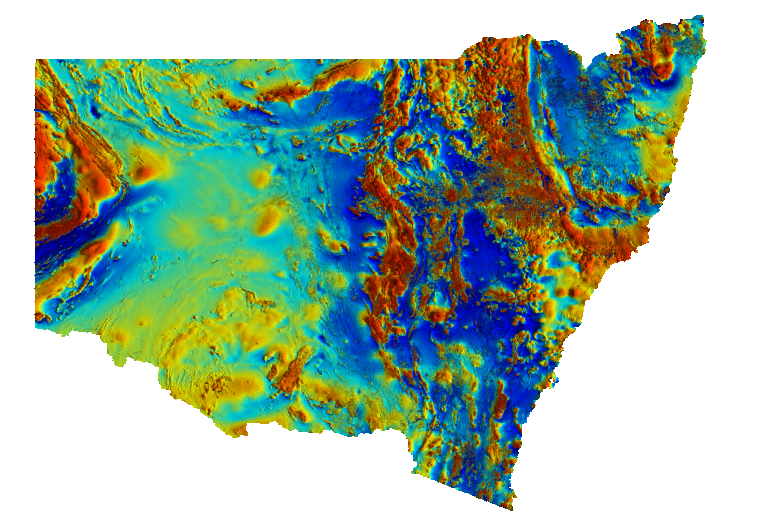
Pseudocolour image of total magnetic intensity (TMI) with a histogram-equalised colour-stretch. Cooler colours indicate lower magnetic intensity values and warmer colours represent higher values. The intensity layer is the TMI greyscale image enhanced by a 3x3 sun filter with the sun illumination set at 45 degrees elevation and 90 degrees azimuth. Variations in the magnetic field are caused by lithological factors, principally magnetite (and/or pyrrhotite) content. This Statewide image was generated by merging many individual airborne magnetic surveys.