 NSW Geoscience Metadata
2025
Type of resources
Available actions
Topics
Keywords
Contact for the resource
Provided by
Years
Formats
Representation types
Update frequencies
status
Scale
-

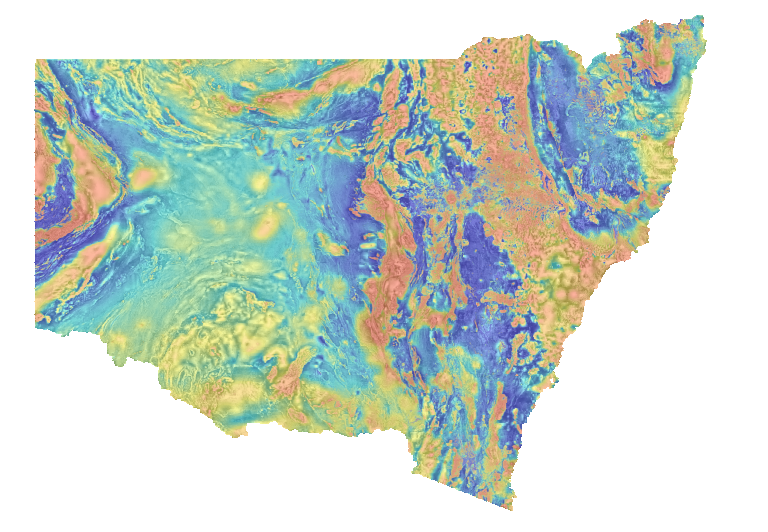
The semi-transparent Bouguer gravity image is displayed using cooler colours (blue) to indicate lower gravity values and warmer colours (red) represent higher values. The underlying greyscale tilt-angle filtered total magnetic intensity image has been reduced to the pole (Tilt TMI RTP). The tilt-angle filter of the total magnetic intensity produces a local positive maximum (white) over a magnetic source and is zero near the edge of the source (grey), and is useful for tracing geological structure below variable depths of cover. Both image layers were generated using a histogram-equalised colour-stretch. Attention: Please ensure your version of the NSW gravity merges contains the date ‘2024-10-30’ in their filename. An update was made to remedy location errors in the initial release. Apologies for any inconvenience.
-

The NSW Mine Reuse project investigated the occurrence of critical metals in mining waste material. It involved a preliminary geochemical and mineralogical characterisation study across multiple metalliferous and coal sites on various waste material types, aiming to identify subsequent secondary prospectivity opportunities. The study was completed in collaboration between the Geological Survey of NSW, the Sustainable Minerals Institute at The University of Queensland, Geoscience Australia and RMIT University. The program consisted of hand-auger drilling and sample collection from various waste sources, including tailings, waste rock, slags, coal rejects and fly ash. Each sample then underwent a 48-element geochemical analysis, with targeted mineralogy and mineral chemistry conducted on selected samples to better understand the distribution of elevated critical elements.
-

The Critical Mineral Analysis Project data set contains the analysis of a representative collection of the Geological Survey of New South Wales (GSNSW) existing rock and analytical powder collections to support the exploration for critical minerals. Existing pulps and powders from whole rock igneous rocks and mine dump samples were submitted for geochemical analysis to ensure the application of modern analytical techniques with significantly improved precision, detection limits for an extended range of trace elements, including the full complement of rare earth elements. Suites of mineral and rock samples from the Economic Rock and Mineral Collection were also selected for analysis from a variety of deposits, deposit types and regions across NSW. These comprise mineralised rocks and drillcore billets, and aggregates of ore minerals.
-
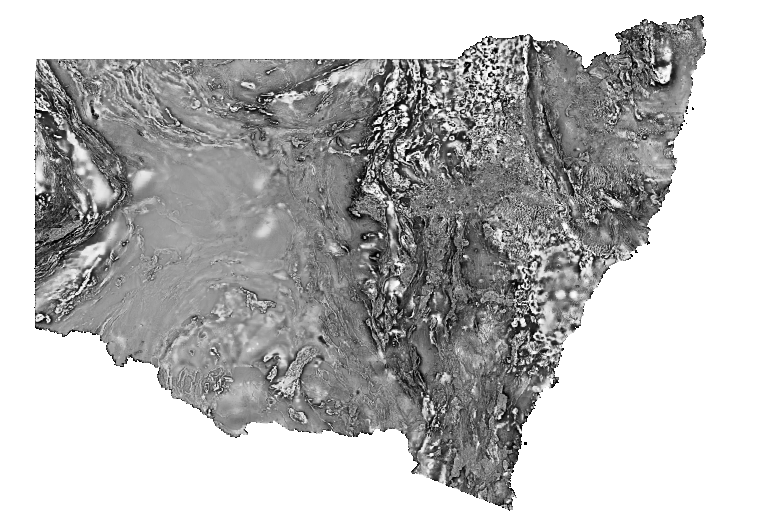
Greyscale image of the first vertical derivative (1VD) of total magnetic intensity reduced to the pole (TMI RTP) which has been upward continued by 250m. Darker tones indicate lower values and lighter tones represent higher values. Reduction to the pole filters magnetic anomalies to appear as if the Earth's magnetic field were locally vertical, as at the magnetic pole (assuming all magnetic sources are inductively magnetised). Upward continuation artificially increases the elevation which removes the influence of high frequency signals caused by near surface geology. The 1VD filter shows the vertical rate of change in the Earth's total magnetic field and enhances boundaries and structural detail of shallow sources. Variations in the magnetic field are caused by lithological factors, principally magnetite (and/or pyrrhotite) content. This Statewide image was generated by merging many individual airborne magnetic surveys.
-

Greyscale image of first vertical derivative (1VD) of isostatic residual gravity (Iso-grav). The 1VD filter shows the rate of change in the isostatic gravity data. Darker tones indicate lower values and lighter tones represent higher values. Attention: Please ensure your version of the NSW gravity merges contains the date ‘2024-10-30’ in their filename. An update was made to remedy location errors in the initial release. Apologies for any inconvenience.
-
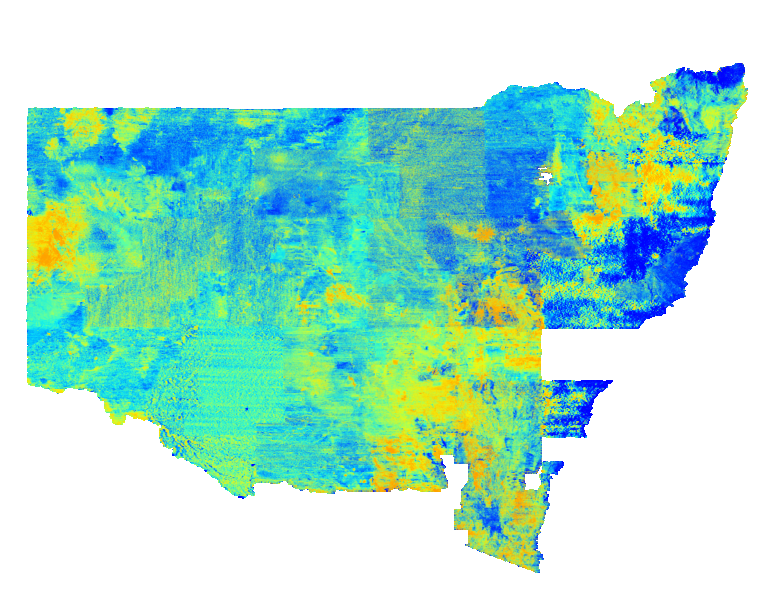
Pseudocolour image of the ratio between uranium and thorium within the upper 20 centimetres of the ground. Cooler colours indicate lower abundances of uranium relative to thorium and warmer colours represent the opposite. Variations in U2/Th ratio are caused varied mineral compositions in host rocks and soils. This statewide image was generated by merging many individual airborne radiometric surveys.
-
The Central NSW 10 metre grid package is a dataset containing best available open-file geophysical data spanning twelve 1:250,000 geological mapsheets, from Cobar in the northwest to Bathurst in the southeast. Available within the package are merged grids and high resolution imagery providing excellent geophysical coverage of the region. Gridded products include: • Digital Elevation Model (DEM) • Total Magnetic Intensity (TMI) • Total Magnetic Intensity Reduced to The Pole (TMI RTP) • Total Magnetic Intensity Reduced to The Pole First Vertical Derivative (TMI RTP 1VD) • Total Magnetic Intensity Reduced to The Pole Second Vertical Derivative (TMI RTP 2VD) • Total Magnetic Intensity Reduced to The Pole Tilt Angle Filter (TMI RTP Tilt) • Potassium Percentage (Kperc) • Thorium Parts Per Million (Thppm) • Uranium Parts Per Million (Uppm) • Radiometric K-Th-U Ternary (KThU) • Radiometric Dose Rate (Dose) • Thorium divided by Potassium (ThdivK) • Uranium divided by Potassium (UdivK) • Uranium divided by Thorium (UdivTh) • Uranium Squared divided by Thorium (U2divTh) • Isostatically Corrected Bouguer Gravity (Iso Grav) Images for each grid are also available, with the addition of: • DEM (Terrain) • TMI RTP overlaid on TMI RTP Tilt • Iso Grav overlaid on TMI RTP Tilt
-

The semi-transparent isostatic residual gravity image is displayed using cooler colours (blue) to indicate lower gravity values and warmer colours (red) represent higher values. The underlying greyscale tilt-angle filtered total magnetic intensity image that has been reduced to the pole (Tilt TMI RTP). The tilt-angle filter of the total magnetic intensity produces a local positive maximum (white) over a magnetic source and is zero near the edge of the source (grey), and is useful for tracing geological structure below variable depths of cover. Both image layers were generated using a histogram-equalised colour-stretch. Attention: Please ensure your version of the NSW gravity merges contains the date ‘2024-10-30’ in their filename. An update was made to remedy location errors in the initial release. Apologies for any inconvenience.
-
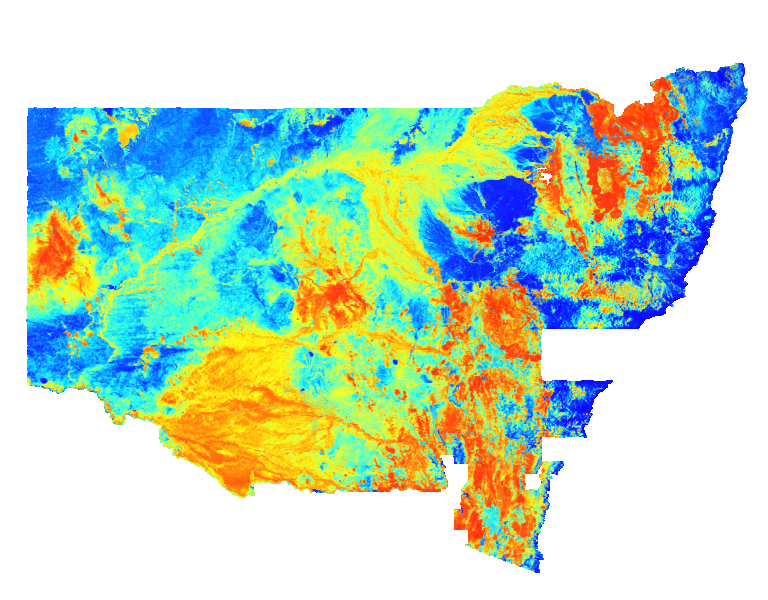
Total magnetic intensity reduced to the pole (TMI RTP) image overlain on tilt-filtered (Tilt) total magnetic intensity reduced to the pole image. The image is a partially-transparent pseudocolour layer of TMI RTP, with a histogram-equalised colour-stretch, overlain on a greyscale intensity layer of the Tilt, with a histogram-equalised stretch. Cooler colours indicate lower values and warmer colours represent higher TMI RTP values. Dark tones indicate lower values and lighter tones represent higher values of the Tilt. Reduction to the pole filters magnetic anomalies to appear as if the Earth's magnetic field were locally vertical, as at the magnetic pole (assuming all magnetic sources are inductively magnetised). The tilt-angle filter produces a positive maximum over the centre of a magnetic source and is zero near the edge of the source, and is useful for tracing geological structure below variable depths of cover. Variations in the magnetic field are caused by lithological factors, principally magnetite (and/or pyrrhotite) content. This Statewide image was generated by merging many individual airborne magnetic surveys.
-
Pseudocolour image of the percentage of potassium (K%) in the upper 20 centimetres of the ground. Cooler colours indicate lower abundances of potassium and warmer colours represent higher abundances. Variations in potassium values are caused by varied mineral compositions in host rocks and soils. This statewide image was generated by merging many individual airborne radiometric surveys.