 NSW Geoscience Metadata
dataset
Type of resources
Available actions
Topics
Keywords
Contact for the resource
Provided by
Years
Formats
Representation types
Update frequencies
status
Scale
-
This map layer shows the locations of in-stream water monitoring stations used by coal mining companies to monitor water quality in the Upper Hunter catchment. This information is provided by the coal companies as part of the Upper Hunter Mining Dialogue in cooperation with NSW Minerals Council and the community. A different coloured symbol is used for each coal company.
-
The Geological Survey of NSW developed a Seamless Geology of UTM Zone 56 during 2014 as part of a project to develop a seamless vector geology dataset of the best available geological mapping data covering the whole of NSW.The overarching aims of the Statewide Seamless Geology Project were to: (i) compile the different original scales, formats and rock unit naming conventions into a consistent, statewide format; (ii) edge-match the geology across existing map sheets; and (iii) interpret the basement geology under cover. The resulting geodatabase comprises a series of layers which include: (i) solid basement geology; (ii) cover rocks (defined as undeformed and unmetamorphosed); (iii) Mesozoic igneous rocks; and (iv) Cenozoic sedimentary and igneous rocks. The project was divided into 3 major stages corresponding to the UTM zones which divide New South Wales. This dataset includes the seamless geology layers from the NSW portion of UTM Zone 56 (ie.east of 150 degrees longitude to the coast).
-
The NSW Government has acquired hyperspectral data to aid geological interpretation. The location of hyperspectral coverage is contained within this layer. The information contained in this publication is based on knowledge and understanding at time of writing (April 2017). Because of advances in knowledge, users are reminded of the need to ensure that information upon which they rely is up to date. The information contained in this publication may not be or may no longer be aligned with government policy nor does the publication indicate or imply government policy.
-
Mineral Resource Areas (MRAs) are areas where NSW local councils has been notified in accordance with Ministerial Direction 1.3 under Section 9.1(2) of the EP&A Act 1979. The direction requires councils to consult with DRNSW if proposed Local Environment Plans (LEPs including planning proposals and re-zonings) are likely to prohibit or restrict development of coal, petroleum, mineral and extractive resources. The direction requires the state government to notify local councils of the locations of current operations and resources of state or regional significance. MRAs should also be used when undertaking the compatibility test required in accordance with Clause 13 of the Mining SEPP. The test must be carried out for any proposed development in the vicinity of existing mines, quarries and petroleum production facilities or resources of state or regional significance.
-
The government will consider releasing a limited number of new areas for coal exploration under the Strategic Release Framework for Coal and Petroleum Exploration. Under this Framework, the government may refer an area to the Advisory Body for Strategic Release (ABSR). If a coal exploration licence is granted, an operator is not permitted to access the land unless they have an access arrangement in place with the landholder. Release of an area for exploration is not a guarantee of mining. An operator would still need to obtain development consent under the planning framework.
-
The Geological Survey of NSW developed a Seamless Geology of UTM Zone 56 during 2014 as part of a project to develop a seamless vector geology dataset of the best available geological mapping data covering the whole of NSW.The overarching aims of the Statewide Seamless Geology Project were to: (i) compile the different original scales, formats and rock unit naming conventions into a consistent, statewide format; (ii) edge-match the geology across existing map sheets; and (iii) interpret the basement geology under cover. The resulting geodatabase comprises a series of layers which include: (i) solid basement geology; (ii) cover rocks (defined as undeformed and unmetamorphosed); (iii) Mesozoic igneous rocks; and (iv) Cenozoic sedimentary and igneous rocks. The project was divided into 3 major stages corresponding to the UTM zones which divide New South Wales. This dataset includes the seamless geology layers from the NSW portion of UTM Zone 56 (ie.east of 150 degrees longitude to the coast).
-
This is a preliminary low-resolution, pseudocolour image of airborne acquired Bouguer gravity with a histogram-equalised colour stretch. Cooler colours indicate lower Bouguer gravity values and warmer colours represent higher values. Bouguer gravity compensates for variations in latitude, 'free-air' elevation and Bouguer correction (assuming a crustal density of 2.67 T/m³). This image shows airborne gravity data from a survey that is ongoing. The Department of Customer Service has contracted two experienced specialist companies to fly the airborne survey. Final data will be available in 2024 at a higher resolution. Preliminary data should not be used in geological interpretations.
-
A subset of the NSW Drillholes dataset focused specifically on Cobar.
-
Core library samples that have been scanned by the NSW Hylogger. The HyLogger system acquires information on rock, ore and alteration minerals in drillcore, chips and pulps that are often difficult or impossible for the human eye to interpret correctly. Reflected light from the samples is broken into hundreds of different wavelengths by several spectrometers, allowing the recognition of unique spectral signatures for each mineral. This technology is also used on cores from petroleum and carbon dioxide (CO2) geosequestration wells to obtain mineralogical data that may complement porosity and permeability studies. X-ray diffraction and X-ray fluorescence instruments are used for rapid characterisation of a wide range of geological materials and for validating HyLogger data. The GSNSW offers a number of HyLogger scanning services to industry and academia. Each service requires a level of investment by the client and offers different periods of confidentiality.
-
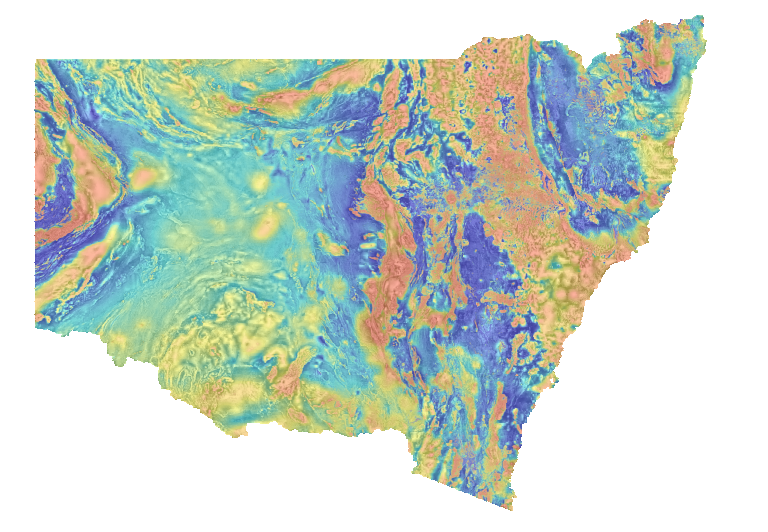
Total magnetic intensity reduced to the pole (TMI RTP) image overlain on tilt-filtered (Tilt) total magnetic intensity reduced to the pole image. The image is a partially-transparent pseudocolour layer of TMI RTP, with a histogram-equalised colour-stretch, overlain on a greyscale intensity layer of the Tilt, with a histogram-equalised stretch. Cooler colours indicate lower values and warmer colours represent higher TMI RTP values. Dark tones indicate lower values and lighter tones represent higher values of the Tilt. Reduction to the pole filters magnetic anomalies to appear as if the Earth's magnetic field were locally vertical, as at the magnetic pole (assuming all magnetic sources are inductively magnetised). The tilt-angle filter produces a positive maximum over the centre of a magnetic source and is zero near the edge of the source, and is useful for tracing geological structure below variable depths of cover. Variations in the magnetic field are caused by lithological factors, principally magnetite (and/or pyrrhotite) content. This Statewide image was generated by merging many individual airborne magnetic surveys.