 NSW Geoscience Metadata
Magnetics
Type of resources
Topics
Keywords
Contact for the resource
Provided by
Years
Formats
status
-
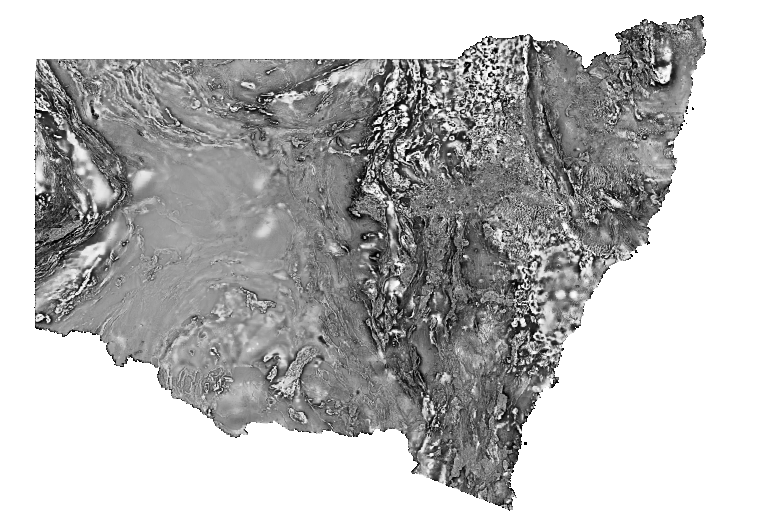
Greyscale image of the first vertical derivative (1VD) of total magnetic intensity reduced to the pole (TMI RTP) which has been upward continued by 250m. Darker tones indicate lower values and lighter tones represent higher values. Reduction to the pole filters magnetic anomalies to appear as if the Earth's magnetic field were locally vertical, as at the magnetic pole (assuming all magnetic sources are inductively magnetised). Upward continuation artificially increases the elevation which removes the influence of high frequency signals caused by near surface geology. The 1VD filter shows the vertical rate of change in the Earth's total magnetic field and enhances boundaries and structural detail of shallow sources. Variations in the magnetic field are caused by lithological factors, principally magnetite (and/or pyrrhotite) content. This Statewide image was generated by merging many individual airborne magnetic surveys.
-
Greyscale image of second vertical derivative (2VD) of total magnetic intensity reduced to the pole (TMI RTP). Darker tones indicate lower values and lighter tones represent higher values. Reduction to the pole filters magnetic anomalies to appear as if the Earth's magnetic field were locally vertical, as at the magnetic pole (assuming all magnetic sources are inductively magnetised). The 2VD filter shows the vertical rate of change in the first vertical derivative (1VD) of the Earth's total magnetic field and enhances boundaries and structural detail of shallow sources further than 1VD. The 2VD filter enhances magnetic textures in the image, however, it also amplifies non-geological noise. Variations in the magnetic field are caused by lithological factors, principally magnetite (and/or pyrrhotite) content. This Statewide image was generated by merging many individual airborne magnetic surveys.
-

Greyscale image of the first vertical derivative (1VD) of total magnetic intensity reduced to the pole (TMI RTP) which has been upward continued by 500m. Darker tones indicate lower values and lighter tones represent higher values. Reduction to the pole filters magnetic anomalies to appear as if the Earth's magnetic field were locally vertical, as at the magnetic pole (assuming all magnetic sources are inductively magnetised). Upward continuation artificially increases the elevation which removes the influence of high frequency signals caused by near surface geology. The 1VD filter shows the vertical rate of change in the Earth's total magnetic field and enhances boundaries and structural detail of shallow sources. Variations in the magnetic field are caused by lithological factors, principally magnetite (and/or pyrrhotite) content. This Statewide image was generated by merging many individual airborne magnetic surveys.
-
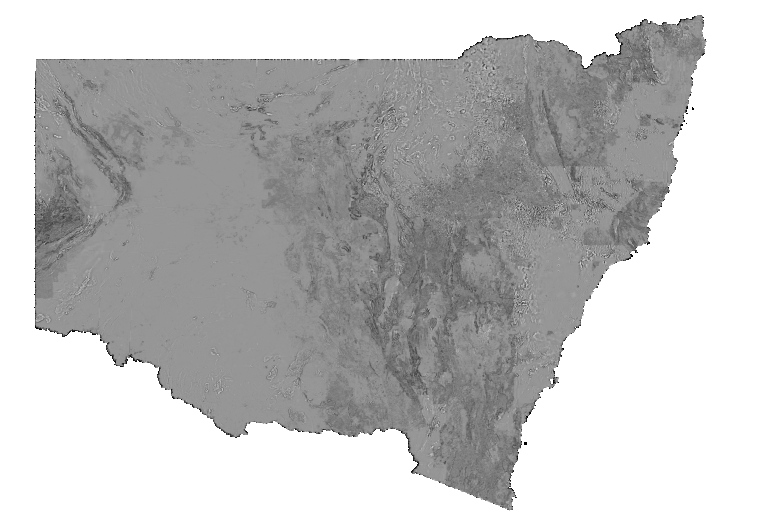
Greyscale image of the tilt-angle filter (Tilt) of total magnetic intensity, reduced to the pole (TMI RTP). Darker tones indicate lower values and lighter tones represent higher values. Reduction to the pole filters magnetic anomalies to appear as if the Earth's magnetic field were locally vertical, as at the magnetic pole (assuming all magnetic sources are inductively magnetised). The Tilt filter produces a positive maximum over the centre of a magnetic source and is zero near the edge of the source, and is useful for tracing geological structure below variable depths of cover. Variations in the magnetic field are caused by lithological factors, principally magnetite (and/or pyrrhotite) content. This Statewide image was generated by merging many individual airborne magnetic surveys.
-
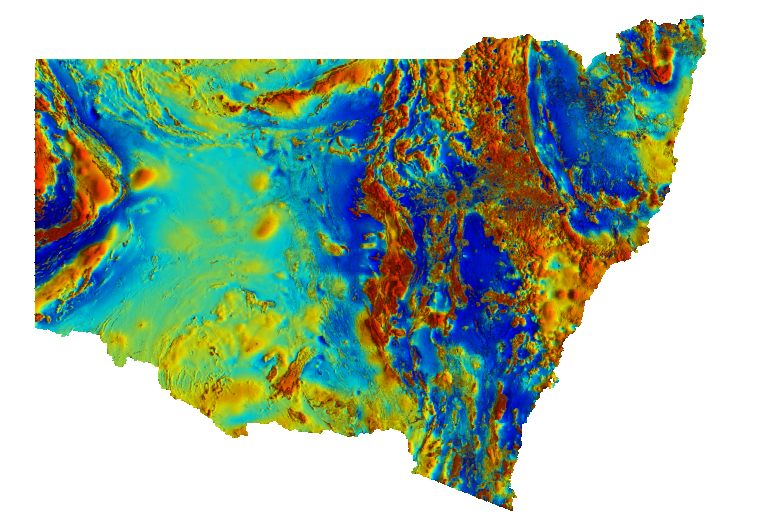
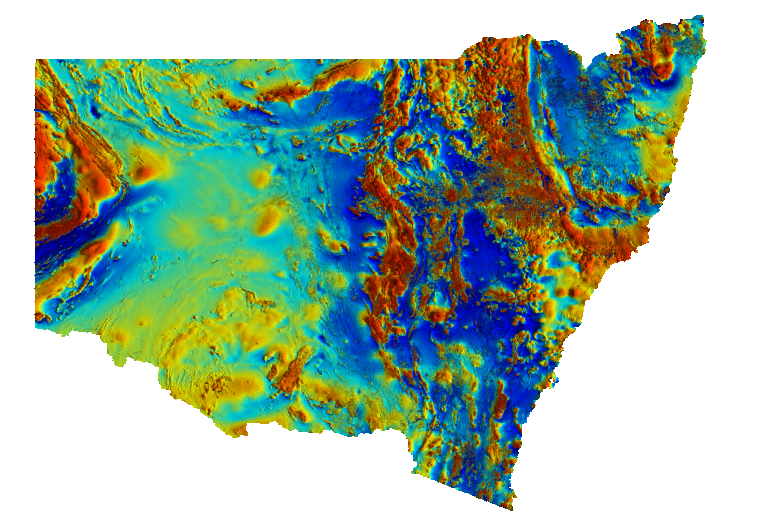
Pseudocolour image of total magnetic intensity reduced to the pole (TMI RTP) with a histogram-equalised colour-stretch. Cooler colours indicate lower magnetic intensity values and warmer colours represent higher values. The intensity layer is the TMI RTP greyscale image enhanced by a 3x3 sun filter with the sun illumination set at 45 degrees elevation and 90 degrees azimuth. Reduction to the pole filters magnetic anomalies to appear as if the Earth's magnetic field were locally vertical, as at the magnetic pole (assuming all magnetic sources are inductively magnetised). Variations in the magnetic field are caused by lithological factors, principally magnetite (and/or pyrrhotite) content. This Statewide image was generated by merging many individual airborne magnetic surveys.
-

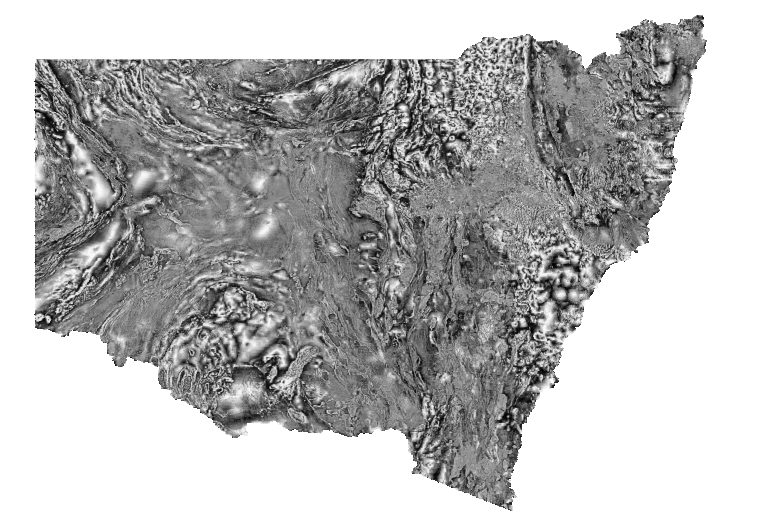
Greyscale image of first vertical derivative (1VD) of total magnetic intensity reduced to the pole (TMI RTP). Darker tones indicate lower values and lighter tones represent higher values. Reduction to the pole filters magnetic anomalies to appear as if the Earth's magnetic field were locally vertical, as at the magnetic pole (assuming all magnetic sources are inductively magnetised). The 1VD filter shows the vertical rate of change in the Earth's total magnetic field and enhances boundaries and structural detail of shallow sources. Variations in the magnetic field are caused by lithological factors, principally magnetite (and/or pyrrhotite) content. This Statewide image was generated by merging many individual airborne magnetic surveys.
-
Pseudocolour image of total magnetic intensity (TMI) with a histogram-equalised colour-stretch. Cooler colours indicate lower magnetic intensity values and warmer colours represent higher values. The intensity layer is the TMI greyscale image enhanced by a 3x3 sun filter with the sun illumination set at 45 degrees elevation and 90 degrees azimuth. Variations in the magnetic field are caused by lithological factors, principally magnetite (and/or pyrrhotite) content. This Statewide image was generated by merging many individual airborne magnetic surveys.