 NSW Geoscience Metadata
2026
Type of resources
Topics
Keywords
Contact for the resource
Provided by
Years
Formats
Representation types
Update frequencies
status
Scale
-
Seismic surveys acquired by NSW and Commonwealth Government Agencies and private companies.
-

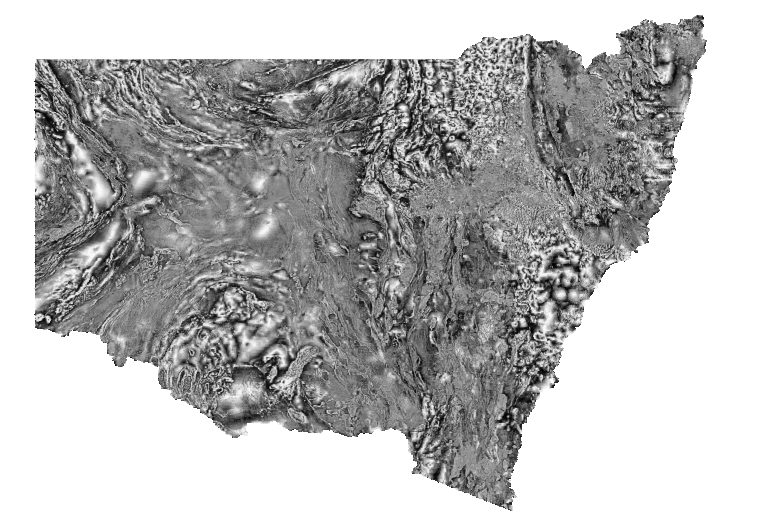
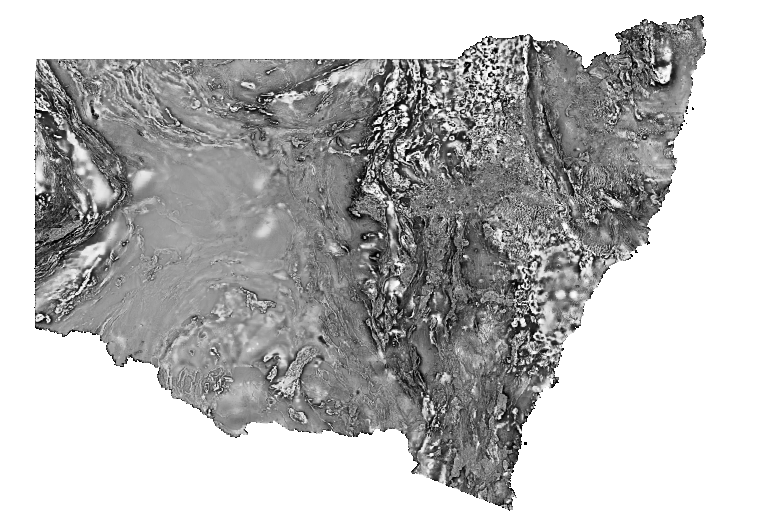
Greyscale image of first vertical derivative (1VD) of total magnetic intensity reduced to the pole (TMI RTP). Darker tones indicate lower values and lighter tones represent higher values. Reduction to the pole filters magnetic anomalies to appear as if the Earth's magnetic field were locally vertical, as at the magnetic pole (assuming all magnetic sources are inductively magnetised). The 1VD filter shows the vertical rate of change in the Earth's total magnetic field and enhances boundaries and structural detail of shallow sources. Variations in the magnetic field are caused by lithological factors, principally magnetite (and/or pyrrhotite) content. This Statewide image was generated by merging many individual airborne magnetic surveys.
-
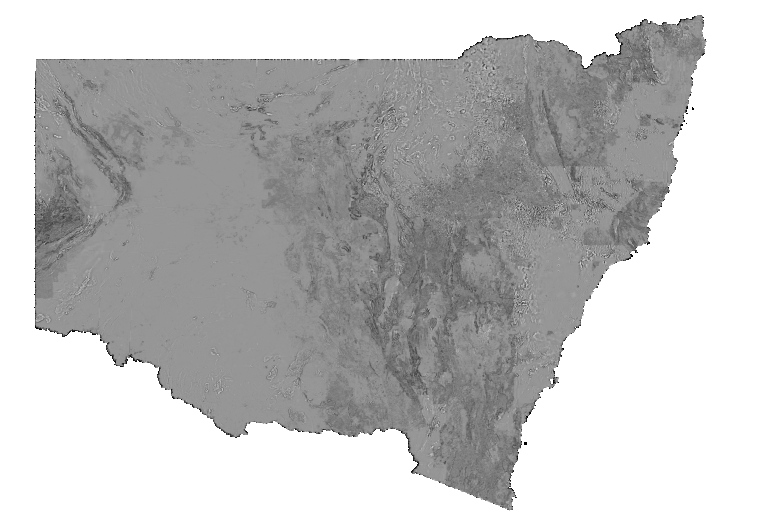
Greyscale image of the tilt-angle filter (Tilt) of total magnetic intensity, reduced to the pole (TMI RTP). Darker tones indicate lower values and lighter tones represent higher values. Reduction to the pole filters magnetic anomalies to appear as if the Earth's magnetic field were locally vertical, as at the magnetic pole (assuming all magnetic sources are inductively magnetised). The Tilt filter produces a positive maximum over the centre of a magnetic source and is zero near the edge of the source, and is useful for tracing geological structure below variable depths of cover. Variations in the magnetic field are caused by lithological factors, principally magnetite (and/or pyrrhotite) content. This Statewide image was generated by merging many individual airborne magnetic surveys.
-
Greyscale image of second vertical derivative (2VD) of total magnetic intensity reduced to the pole (TMI RTP). Darker tones indicate lower values and lighter tones represent higher values. Reduction to the pole filters magnetic anomalies to appear as if the Earth's magnetic field were locally vertical, as at the magnetic pole (assuming all magnetic sources are inductively magnetised). The 2VD filter shows the vertical rate of change in the first vertical derivative (1VD) of the Earth's total magnetic field and enhances boundaries and structural detail of shallow sources further than 1VD. The 2VD filter enhances magnetic textures in the image, however, it also amplifies non-geological noise. Variations in the magnetic field are caused by lithological factors, principally magnetite (and/or pyrrhotite) content. This Statewide image was generated by merging many individual airborne magnetic surveys.
-
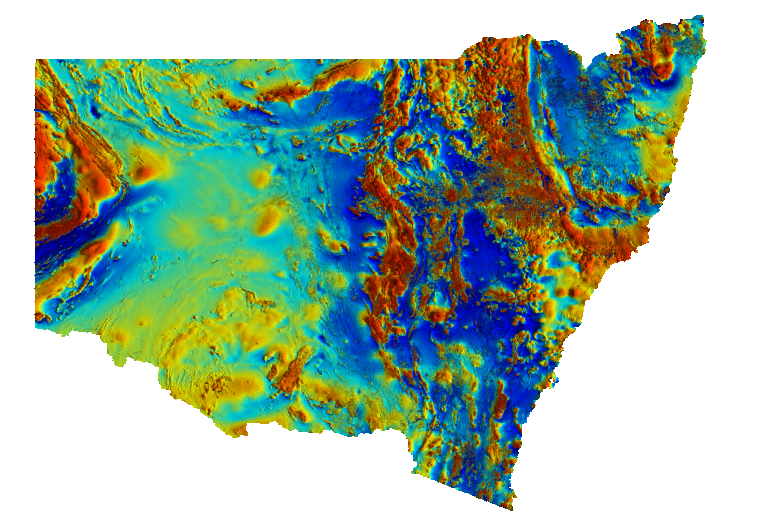
Pseudocolour image of total magnetic intensity (TMI) with a histogram-equalised colour-stretch. Cooler colours indicate lower magnetic intensity values and warmer colours represent higher values. The intensity layer is the TMI greyscale image enhanced by a 3x3 sun filter with the sun illumination set at 45 degrees elevation and 90 degrees azimuth. Variations in the magnetic field are caused by lithological factors, principally magnetite (and/or pyrrhotite) content. This Statewide image was generated by merging many individual airborne magnetic surveys.
-

The NSW Seamless Geology Project was originally a five-year initiative of the Geological Survey of New South Wales which commenced in late 2013 and aimed to provide a statewide compilation of the best available digital geological mapping data in an internally consistent format. The overarching aims of the NSW Seamless Geology Project were to: (i) compile the different original scales, formats and rock unit naming conventions into a consistent, statewide format; (ii) edge-match the geology across existing map sheets; and (iii) interpret the basement geology under cover. The resulting geodatabase comprises a series of layers which include: (i) solid basement geology; (ii) cover rocks (defined as undeformed and unmetamorphosed); (iii) Mesozoic igneous rocks; and (iv) Cenozoic sedimentary and igneous rocks. Due to the size of the project, the work was divided into UTM zones, starting in the east with Zone 56, then moving west to Zone 54, and finishing with Zone 55. The western half of Zone 55 was completed in 2018, after which the results were merged with the previously completed Zones to produce version 1 of the NSW Seamless Geology dataset. Completion of this stage saw the end of phase 1 of the Seamless Geology Project, but it is intended that the Seamless Geology dataset will be continually updated and refined as new digital geological mapping data becomes available. Updates to the Seamless Geology dataset generally occur on an annual basis. Version 2.6 is the 8th major update to the NSW Seamless Geology and was released in 2026. This release includes major remapping of the northern Rockley–Gulgong Volcanic Belt; a significant upgrade to the mapping of Broughton Island; significant updates to the Lachlan Orogen and Cenozoic Sedimentary Province in the Canbelego 1:100,000 map sheet area; and attribute updates, data additions, and minor error fixes to all layers. NOTE: A substantial amount of overlay, erase and intersect geoprocessing of the original multi-layered Seamless Geology was undertaken to produce the single layer surface NSW Seamless Geology dataset. Due to small tolerance differences between different layers in the Seamless Geology dataset, this has, in some places, created small “sliver” polygons between boundaries common to more than one layer of the original multi-layered NSW Seamless Geology. This is a known issue with the current single layer Seamless Geology dataset and while some attempt has been made to resolve these issues, a number of small “sliver” polygons remain. Users are cautioned to be aware of this problem when using this dataset at high zoom levels (ie. under 1:1,000 scale) and to refer to the full Seamless Geology dataset for clarification.
-
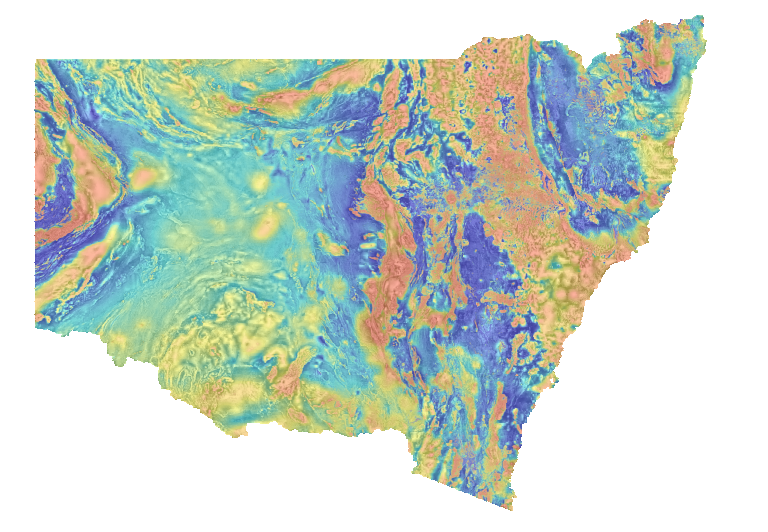
Total magnetic intensity reduced to the pole (TMI RTP) image overlain on tilt-filtered (Tilt) total magnetic intensity reduced to the pole image. The image is a partially-transparent pseudocolour layer of TMI RTP, with a histogram-equalised colour-stretch, overlain on a greyscale intensity layer of the Tilt, with a histogram-equalised stretch. Cooler colours indicate lower values and warmer colours represent higher TMI RTP values. Dark tones indicate lower values and lighter tones represent higher values of the Tilt. Reduction to the pole filters magnetic anomalies to appear as if the Earth's magnetic field were locally vertical, as at the magnetic pole (assuming all magnetic sources are inductively magnetised). The tilt-angle filter produces a positive maximum over the centre of a magnetic source and is zero near the edge of the source, and is useful for tracing geological structure below variable depths of cover. Variations in the magnetic field are caused by lithological factors, principally magnetite (and/or pyrrhotite) content. This Statewide image was generated by merging many individual airborne magnetic surveys.
-
Greyscale image of the first vertical derivative (1VD) of total magnetic intensity reduced to the pole (TMI RTP) which has been upward continued by 250m. Darker tones indicate lower values and lighter tones represent higher values. Reduction to the pole filters magnetic anomalies to appear as if the Earth's magnetic field were locally vertical, as at the magnetic pole (assuming all magnetic sources are inductively magnetised). Upward continuation artificially increases the elevation which removes the influence of high frequency signals caused by near surface geology. The 1VD filter shows the vertical rate of change in the Earth's total magnetic field and enhances boundaries and structural detail of shallow sources. Variations in the magnetic field are caused by lithological factors, principally magnetite (and/or pyrrhotite) content. This Statewide image was generated by merging many individual airborne magnetic surveys.
-
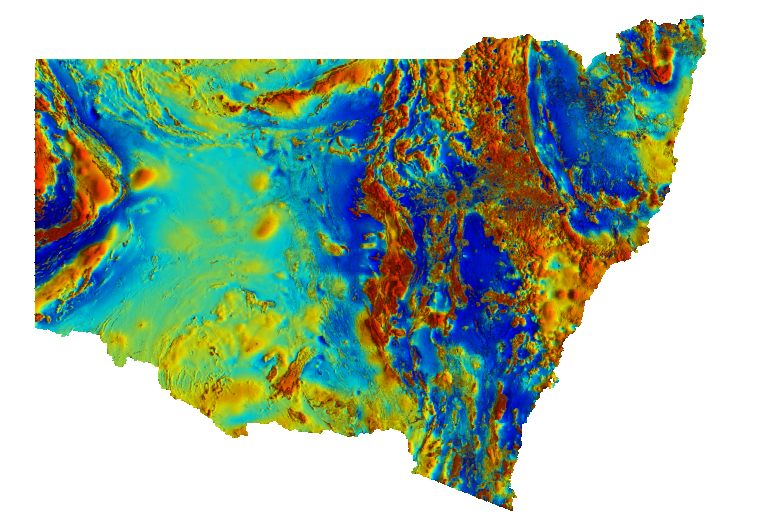
Pseudocolour image of total magnetic intensity reduced to the pole (TMI RTP) with a histogram-equalised colour-stretch. Cooler colours indicate lower magnetic intensity values and warmer colours represent higher values. The intensity layer is the TMI RTP greyscale image enhanced by a 3x3 sun filter with the sun illumination set at 45 degrees elevation and 90 degrees azimuth. Reduction to the pole filters magnetic anomalies to appear as if the Earth's magnetic field were locally vertical, as at the magnetic pole (assuming all magnetic sources are inductively magnetised). Variations in the magnetic field are caused by lithological factors, principally magnetite (and/or pyrrhotite) content. This Statewide image was generated by merging many individual airborne magnetic surveys.
-

Greyscale image of the first vertical derivative (1VD) of total magnetic intensity reduced to the pole (TMI RTP) which has been upward continued by 500m. Darker tones indicate lower values and lighter tones represent higher values. Reduction to the pole filters magnetic anomalies to appear as if the Earth's magnetic field were locally vertical, as at the magnetic pole (assuming all magnetic sources are inductively magnetised). Upward continuation artificially increases the elevation which removes the influence of high frequency signals caused by near surface geology. The 1VD filter shows the vertical rate of change in the Earth's total magnetic field and enhances boundaries and structural detail of shallow sources. Variations in the magnetic field are caused by lithological factors, principally magnetite (and/or pyrrhotite) content. This Statewide image was generated by merging many individual airborne magnetic surveys.