 NSW Geoscience Metadata
Type of resources
Available actions
Topics
Keywords
Contact for the resource
Provided by
Years
Formats
Representation types
Update frequencies
status
Service types
Scale
-
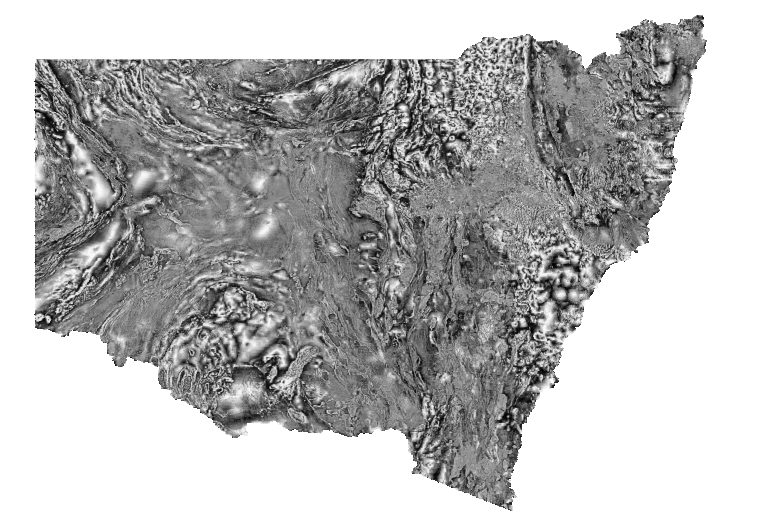
Greyscale image of the tilt-angle filter (Tilt) of total magnetic intensity, reduced to the pole (TMI RTP). Darker tones indicate lower values and lighter tones represent higher values. Reduction to the pole filters magnetic anomalies to appear as if the Earth's magnetic field were locally vertical, as at the magnetic pole (assuming all magnetic sources are inductively magnetised). The Tilt filter produces a positive maximum over the centre of a magnetic source and is zero near the edge of the source, and is useful for tracing geological structure below variable depths of cover. Variations in the magnetic field are caused by lithological factors, principally magnetite (and/or pyrrhotite) content. This Statewide image was generated by merging many individual airborne magnetic surveys.
-
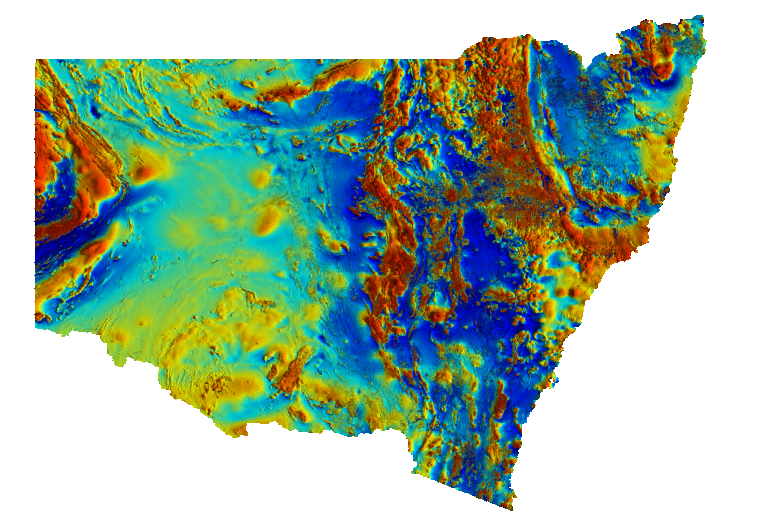
Pseudocolour image of total magnetic intensity (TMI) with a histogram-equalised colour-stretch. Cooler colours indicate lower magnetic intensity values and warmer colours represent higher values. The intensity layer is the TMI greyscale image enhanced by a 3x3 sun filter with the sun illumination set at 45 degrees elevation and 90 degrees azimuth. Variations in the magnetic field are caused by lithological factors, principally magnetite (and/or pyrrhotite) content. This Statewide image was generated by merging many individual airborne magnetic surveys.
-

The Critical Mineral Analysis Project data set contains the analysis of a representative collection of the Geological Survey of New South Wales (GSNSW) existing rock and analytical powder collections to support the exploration for critical minerals. Existing pulps and powders from whole rock igneous rocks and mine dump samples were submitted for geochemical analysis to ensure the application of modern analytical techniques with significantly improved precision, detection limits for an extended range of trace elements, including the full complement of rare earth elements. Suites of mineral and rock samples from the Economic Rock and Mineral Collection were also selected for analysis from a variety of deposits, deposit types and regions across NSW. These comprise mineralised rocks and drillcore billets, and aggregates of ore minerals.
-
The petrophysics database contains petrophysical (rock physical properties) data managed and acquired by the Geological Survey of NSW (GSNSW). Petrophysical properties recorded are: magnetic susceptibility (volume normalised); principal axes and degree of anisotropy of magnetic susceptibility; natural remanent magnetisation (NRM) intensity and direction; remanent magnetisation component directions; Koenigsberger (Q) ratio; saturated density; dry density; grain density; porosity. Vector and tensor magnetic properties (remanence and AMS) are oriented to in-situ (geographic) and fold-corrected (stratigraphic) coordinates where sample and bedding orientation are known.
-
This collection contains mineral specimens from locations of economic mineral importance in NSW>
-
A subset of the NSW water bore dataset focused specifically on Cobar.
-
Please view Matthews and Sheldon (2024) for full description and instructions: Contact Sam at samuel.matthews@regional.nsw.gov.au if you have any difficulty accessing the paper.
-

The semi-transparent Bouguer gravity image is displayed using cooler colours (blue) to indicate lower gravity values and warmer colours (red) represent higher values. The underlying greyscale tilt-angle filtered total magnetic intensity image has been reduced to the pole (Tilt TMI RTP). The tilt-angle filter of the total magnetic intensity produces a local positive maximum (white) over a magnetic source and is zero near the edge of the source (grey), and is useful for tracing geological structure below variable depths of cover. Both image layers were generated using a histogram-equalised colour-stretch. Attention: Please ensure your version of the NSW gravity merges contains the date ‘2024-10-30’ in their filename. An update was made to remedy location errors in the initial release. Apologies for any inconvenience.
-
The Competitive Allocation Pathway is designed to maximise the value of a suitable unallocated coal resource through a competitive process. The Department of Regional NSW’s (Regional NSW) Guideline for the Competitive Allocation of Coal (December 2020) sets out when the Competitive Allocation Pathway applies.
-
The New South Wales 1:1 500 000 scale geology has been compiled from numerous geological maps and regional geological synthesis datasets from the Geological Survey of New South Wales and Geoscience Australia. As part of a project to produce a surface geology map of Australia, Geoscience Australia (Liu et al. 2005) undertook substantial simplification and generalisation of these datasets to produce a seamless geology dataset of New South Wales at 1:1 000 000. This 1:1 000 000 geology dataset has been further simplified, generalised and updated by the Geological Survey of New South Wales to produce the present data set at 1:1 500 000