 NSW Geoscience Metadata
Geological Survey of NSW
Type of resources
Available actions
Topics
Keywords
Contact for the resource
Provided by
Years
Formats
Representation types
Update frequencies
status
Service types
Scale
-
This vector contains the boundary and flight lines of Infill Area D. Infill Area D is part of the MinEx Collaborative Research Centre (CRC) Cobar Airborne Electromagnetic (AEM) survey. This survey was a collaboration between the Geological Survey of NSW (GSNSW) and Geoscience Australia. Infill D was funded by Legacy Minerals Pty. Ltd. Regional lines were funded by GSNSW.
-
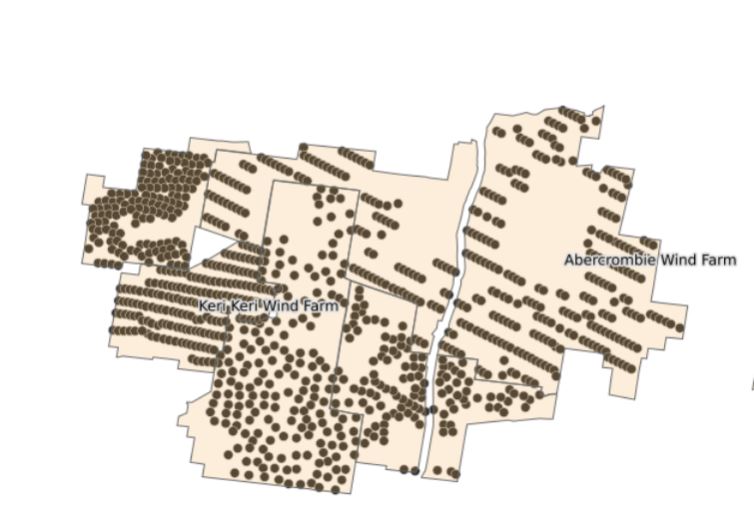
Wind farms dataset displays the location of wind farms in NSW. Wind Farms contain wind turbines, which can be up to 200m tall.
-
Hydrogeochemistry is the sampling and analysis of water to test its chemical properties. The chemistry of bore water can provide clues to the properties of the underlying rocks it has flowed through. Hydrogeochemistry data provides useful information about the quality of groundwater and the processes affecting it. The data is useful for landholders and local government agencies in assessing groundwater resources and their suitability for human and animal consumption, and for industry, other government agencies and scientists to assist with targeting and assessment of natural resources in the earth’s crust. The hydrogeochemistry data presented here has been sourced from various entities including the Geological Survey of New South Wales (GSNSW), Water NSW, CSIRO, and Geoscience Australia (GA). GSNSW and GA collect hydrogeochemistry data on a project basis. CSIRO has curated a groundwater hydrochemistry dataset by collating and standardising data from most State and Territory lead water agencies. Data within NSW will be continually added to this dataset as it is collected or acquired by GSNSW in the future. The hydrogeochemistry dataset presented here includes the following data: • Field measurements and laboratory analyses, such as pH, electrical conductivity, and total dissolved solids (TDS, a measure of salinity) • Major and minor ions, such as sodium and calcium • Trace element metals and non-metals, such as gold, silver, copper and zinc • Stable and radioactive isotopes, such as oxygen-18, carbon-14, and sulphur-34 In addition to this, CSIRO has calculated variables such as saturation indices, which are derived from the hydrochemistry measurements. Information for methodologies used by CSIRO, including the saturation indices, is available from the CSIRO Research Publications Repository.
-
This layer shows the boundary of the AusLAMP NSW survey and the station locations. Data were acquired by a collaboration between GSNSW and Geoscience Australia. Data were used to create a 3D resistivity model of the crust from 10 km depth to 200 km depth.
-
Locations of geotechnical reports, plans and heritage documents compiled from NSW Public Works records. These reports are considered historic records.
-
The petrophysics database contains petrophysical (rock physical properties) data managed and acquired by the Geological Survey of NSW (GSNSW). Petrophysical properties recorded are: magnetic susceptibility (volume normalised); principal axes and degree of anisotropy of magnetic susceptibility; natural remanent magnetisation (NRM) intensity and direction; remanent magnetisation component directions; Koenigsberger (Q) ratio; saturated density; dry density; grain density; porosity. Vector and tensor magnetic properties (remanence and AMS) are oriented to in-situ (geographic) and fold-corrected (stratigraphic) coordinates where sample and bedding orientation are known.
-
The Geological Survey of NSW developed a Seamless Geology of UTM Zone 56 during 2014 as part of a project to develop a seamless vector geology dataset of the best available geological mapping data covering the whole of NSW.The overarching aims of the Statewide Seamless Geology Project were to: (i) compile the different original scales, formats and rock unit naming conventions into a consistent, statewide format; (ii) edge-match the geology across existing map sheets; and (iii) interpret the basement geology under cover. The resulting geodatabase comprises a series of layers which include: (i) solid basement geology; (ii) cover rocks (defined as undeformed and unmetamorphosed); (iii) Mesozoic igneous rocks; and (iv) Cenozoic sedimentary and igneous rocks. The project was divided into 3 major stages corresponding to the UTM zones which divide New South Wales. This dataset includes the seamless geology layers from the NSW portion of UTM Zone 56 (ie.east of 150 degrees longitude to the coast).
-

Basement type interpreted by Geognostics with support from government, academia and industry. The basement type describes the geological processes that has produced each basement block
-
AEM curtains are a set of cross-sections generated using geophysical inversion to convert AEM data to conductivity (m/S) versus depth below surface (m). These data represent the conductivity of soil and rocks to a depth of about 400 m. A pseudocolour-stretch has been applied to the data. Blue represents low conductivity values and red represents high values. The colours vary due to; (1) natural variations in the electrical properties of soils, rocks, minerals and groundwater, (2) man-made structures, radio-transmissions and lightning strike and (3) AEM system artefacts.
-

Depth to the Lithosphere–Asthenosphere Boundary (LAB) modelled by Geognostics with support from government, academia and industry. The LAB surface is the base of the ridgid lithosphere and the top of the ductile asthenosphere. In geothermal terms it marks a thermal and mechanical tranisition in the Earth at a temperature of 1330 °C. This surface is modelled using themal modelling (mantle heat flow, crustal heat production, thermal conductivity, Moho depth and lithospheric structure) seismic tomography, magnetotellurics, global and regional geodynamic models and tectonic context.