 NSW Geoscience Metadata
Geoscientific information
Type of resources
Available actions
Topics
Keywords
Contact for the resource
Provided by
Years
Formats
Representation types
Update frequencies
status
Scale
-
Map blocks and map units are based on a system originally devised by the British Ordinance Survey. Each 1:1 million scale map sheet is subdivided into 3456 graticular map blocks, each measuring 5’ of latitude by 5’ of longitude. These map blocks are further subdivided into 25 1’ by 1’ map units. A map unit is approximately 3 square kilometres in size. Map blocks and map units are used in New South Wales to define certain types of titles. Petroleum exploration titles (PELs) are applied for and granted as a series of map blocks (Map sheet, block number), and mineral exploration titles, which tend to be smaller in size, are defined as a list of map units.
-
Geophysics survey data has been reported to the NSW government and released under the requirements of the NSW Mining Act 1992. Contained within this vector file is the location of surveys and acquisition parameters. These surveys use uncommon techniques.
-
Locations of geotechnical reports, plans and heritage documents compiled from NSW Public Works records. These reports are considered historic records.
-
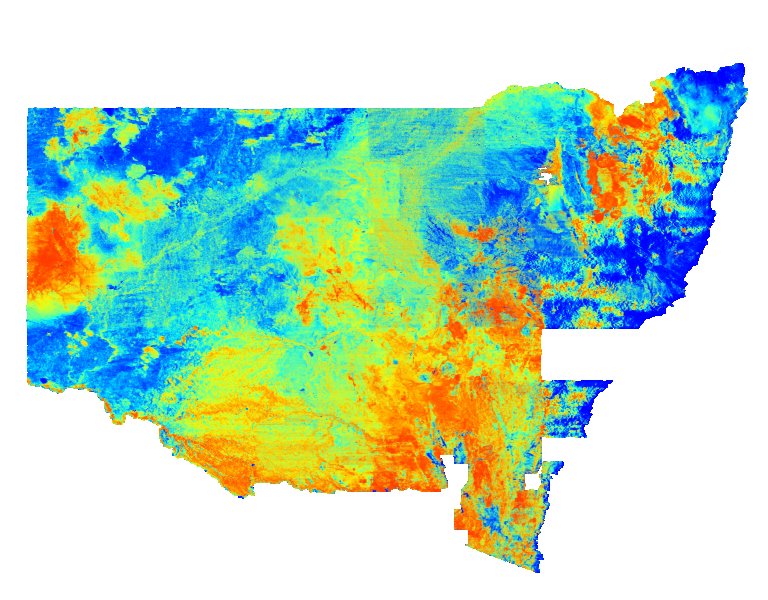
Pseudocolour image of the concentration of uranium in parts per million within in the upper 20 centimetres of the ground. Cooler colours indicate lower abundances of uranium and warmer colours represent higher abundances. Variations in uranium values are caused by varied mineral compositions in host rocks and soils. This statewide image was generated by merging many individual airborne radiometric surveys.
-
Depth contours derived from the NSW Basement Elevation Model.
-
In 2016, the Geological Survey of NSW (GSNSW) published a state-wide depth to basement 3D model (Robinson 2016, 2017). Since then, new geological and geophysical data have been released and used for the construction of basin-scale 3D geological models for the southern Thomson Orogen and the Sydney, Gunnedah and Bowen basins (Davidson 2019; Oliveira and Davidson 2019; Oliveira et al. 2019). The basement topography under these regions was modelled using constraints from drillholes, seismic, Seamless Geology, magnetics and gravity data. The results have now been incorporated into the updated Statewide 3D Basement Elevation Model reported herein.
-
In 2023, the Geological Survey of NSW (GSNSW) engaged Geognostics to perform a review and update of the previous OZ SEEBASE 2021. Previous SEEBASE® studies of NSW basins undertaken by Frogtech Geoscience were undertaken over 15 years ago, and significant new data have been acquired since that time (drillholes, gravity, magnetics, seismic, etc.), along with on-going research and consolidation of statewide interpretations undertaken by the Geological Survey of NSW (GSNSW; i.e., the Seamless Geology Map of NSW by Colquhoun et al., 2022).
-
The Geological Survey of NSW developed a Seamless Geology of UTM Zone 56 during 2014 as part of a project to develop a seamless vector geology dataset of the best available geological mapping data covering the whole of NSW.The overarching aims of the Statewide Seamless Geology Project were to: (i) compile the different original scales, formats and rock unit naming conventions into a consistent, statewide format; (ii) edge-match the geology across existing map sheets; and (iii) interpret the basement geology under cover. The resulting geodatabase comprises a series of layers which include: (i) solid basement geology; (ii) cover rocks (defined as undeformed and unmetamorphosed); (iii) Mesozoic igneous rocks; and (iv) Cenozoic sedimentary and igneous rocks. The project was divided into 3 major stages corresponding to the UTM zones which divide New South Wales. This dataset includes the seamless geology layers from the NSW portion of UTM Zone 56 (ie.east of 150 degrees longitude to the coast).
-
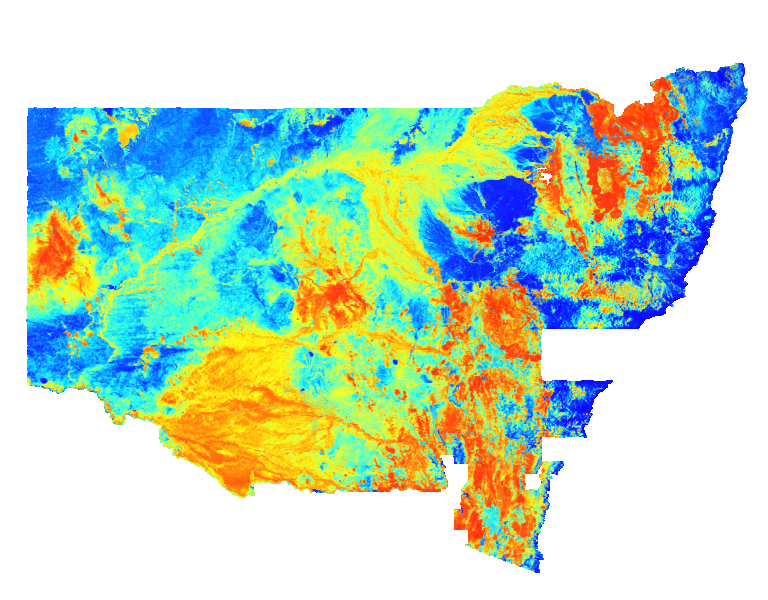
Pseudocolour image of the percentage of potassium (K%) in the upper 20 centimetres of the ground. Cooler colours indicate lower abundances of potassium and warmer colours represent higher abundances. Variations in potassium values are caused by varied mineral compositions in host rocks and soils. This statewide image was generated by merging many individual airborne radiometric surveys.
-
This layer shows a depth slice from a 3D resistivity model of the crust derived from an inversion of the AusLAMP NSW long period MT data.